STATION_01 | PYTHON | PANDAS
QUANT_PIPELINE √
MARKET DATA | QUALITY CONTROL | OUTLIER DETECTION

PROJECTS
Geometry is the shared language. Regimes are manifolds, signals are spectra, and markets are fields. Four projects, one method: build models, test assumptions, and turn mathematical structure into working computation.
MARKET DATA | QUALITY CONTROL | OUTLIER DETECTION
COVARIANCE GEOMETRY | DIMENSION REDUCTION | REGIME DETECTION

NUMERICAL METHODS | SPECTRAL ANALYSIS | SIGNAL VALIDATION

NUMERICAL METHODS | SPECTRAL ANALYSIS | SIGNAL VALIDATION
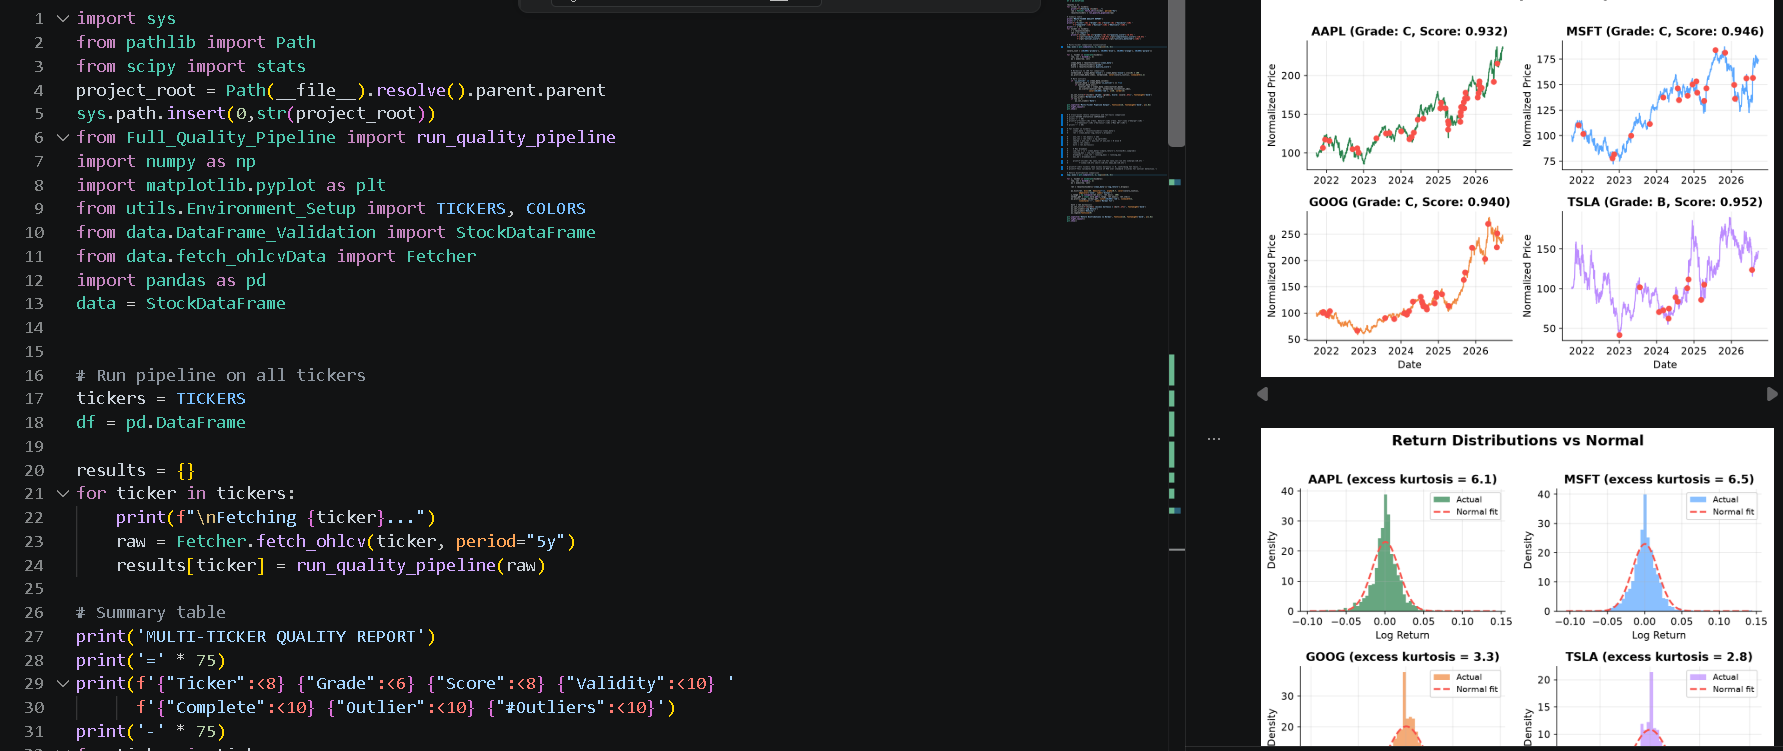
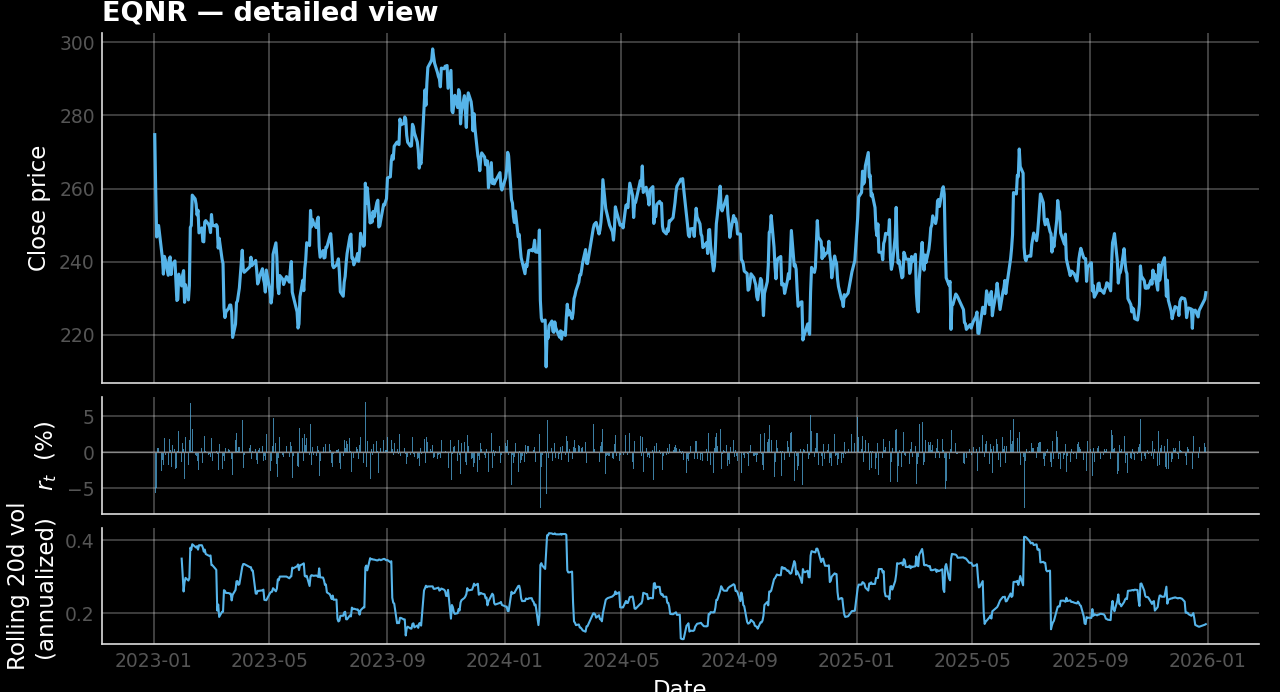
A quantitative investigation of data integrity, anomaly detection and portfolio sensitivity. Financial models are only as reliable as the data they consume. A price series can look reasonable while containing propagating errors. This project starts with five Norwegian equities --- EQNR, DNB, TEL, NAS and NHY --- using adjusted daily closing prices from 2023 to 2025. The project's practical question: How severely do data anomalies distort downstream portfolio weights and risk metrics?
The first step is to establish what the dataset contains and verify it against a set of data-quality checks.The dataset then becomes a controlled baseline.
Here is an adjusted closing-price panel, not raw OHLCV data. With the column type: Yahoo adjusted close, in NOK the pipeline's job on this file is to certify it, and to react to corruption when we later introduce it.
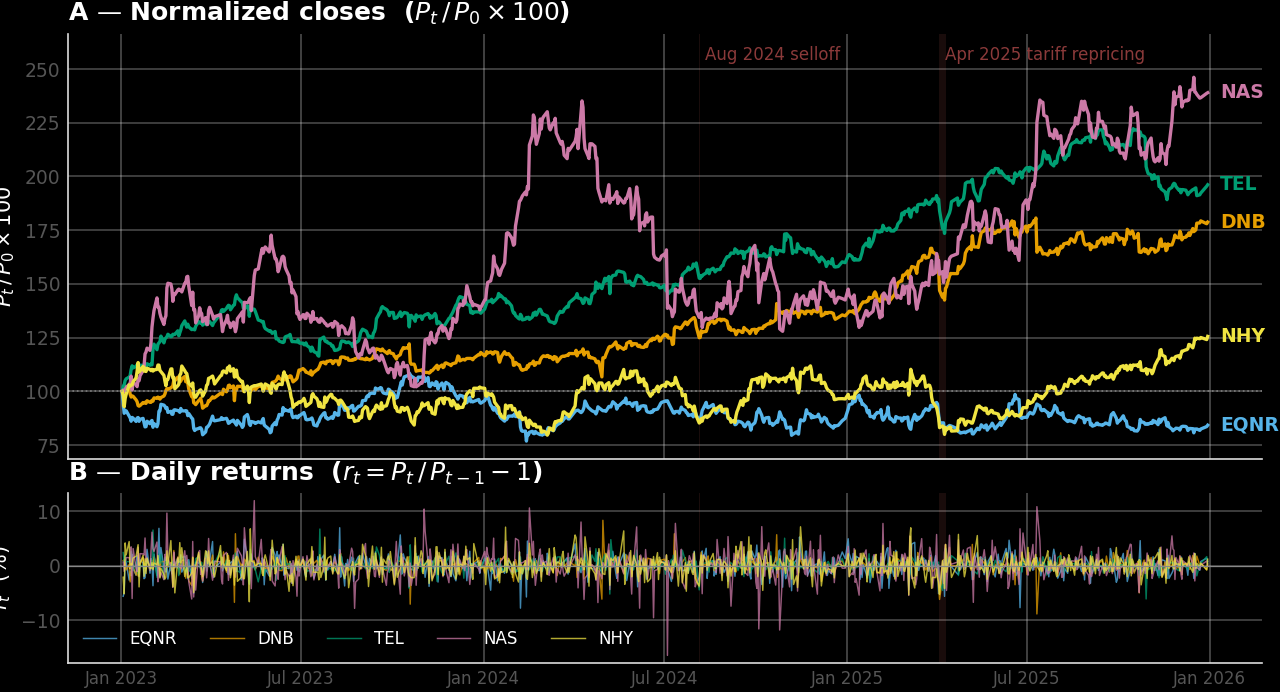
The next stage introduces controlled faults—such as isolated price spikes or missing observations—and measures their effects on returns, risk estimates, and portfolio weights. This creates a direct link between software reliability and financial consequences.
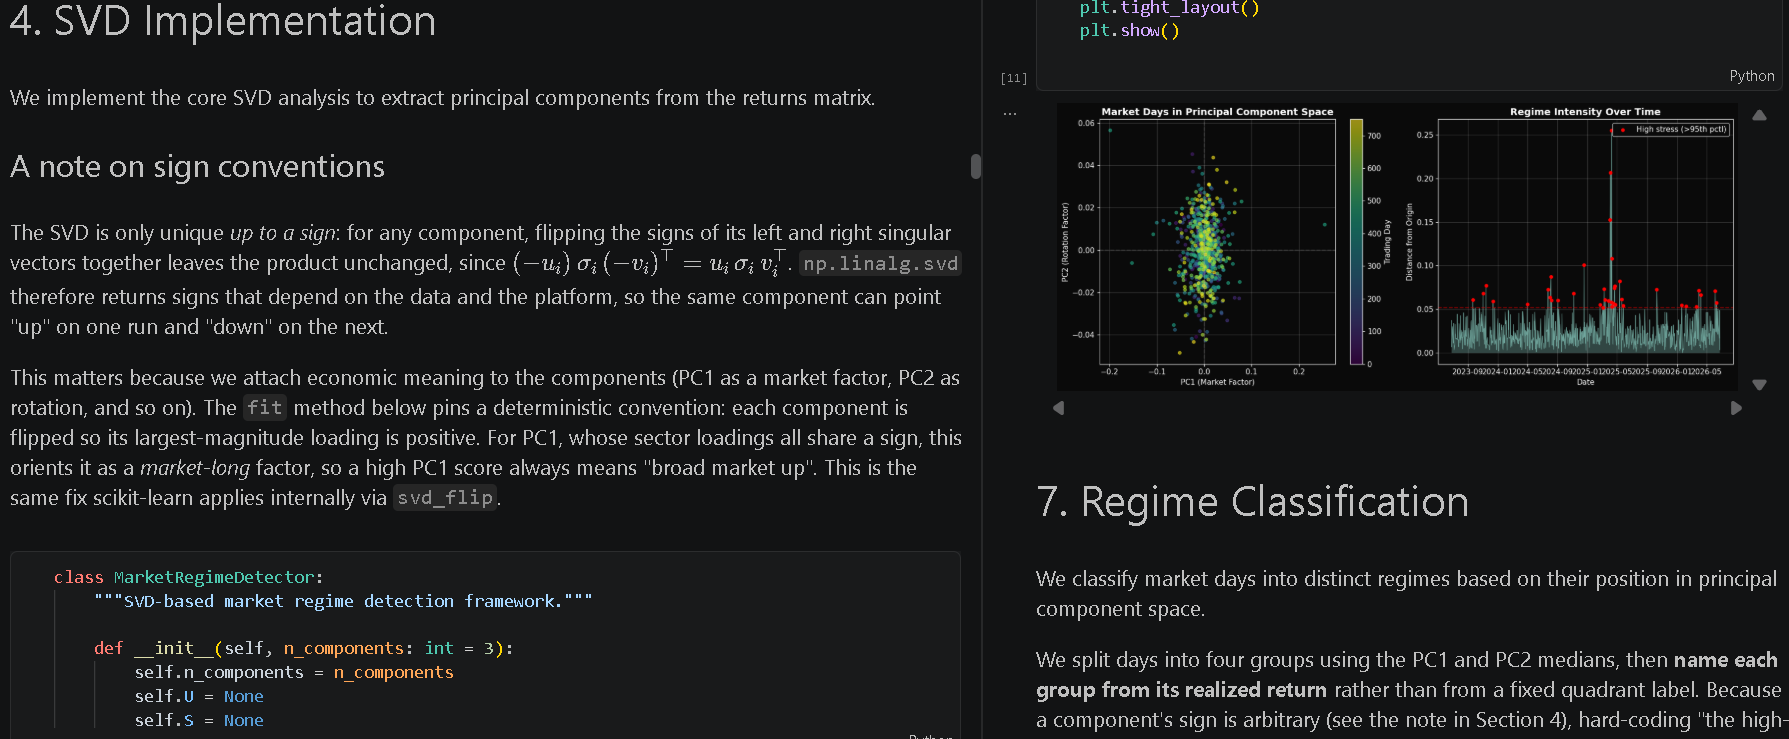
Bridging data integrity with predictive geometry. Building directly on the Oslo data-quality pipeline, this station tracks how structural market regimes evolve across eleven S&P 500 sector ETFs. Using rolling SVD/PCA, we map market behavior into distinct manifolds, transforming historical data anomalies into predictive features for forward-looking volatility regimes.
Applying SVD to a 63-day trailing return window. PC1 captures the macro market factor (positive loading across all sectors), while PC2 functions as a rotation factor (Defensive vs. Discretionary). Regimes are partitioned by medians and labeled via realized equal-weight returns to avoid gauge choices.
In principal component space, regimes separate cleanly into distinct economic states: Risk-On, Risk-Off Stress, Defensive Rally, and Broad Decline. Each sector exhibits a predictable signature across these states.
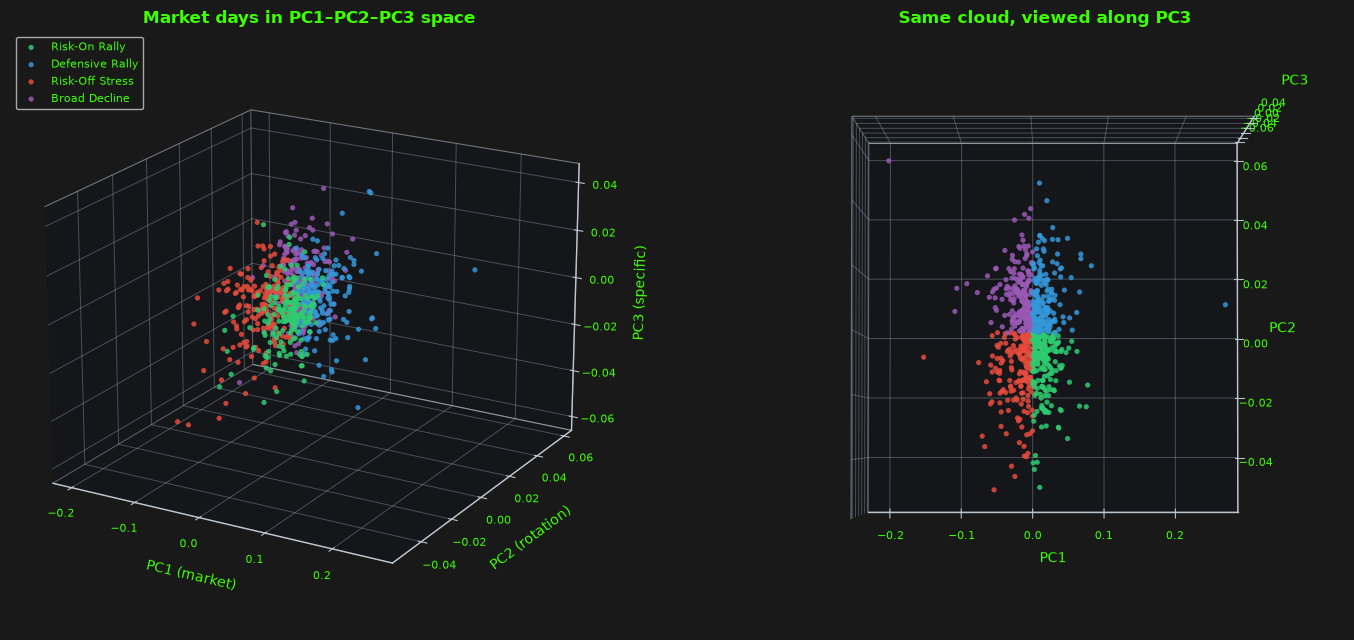
The regimes are not arbitrary partitions of the return space. Every sector has a distinct sign pattern across the four regimes: Technology earns +157 bps/day in Risk-On and loses −145 bps/day in Risk-Off Stress; Utilities and Consumer Staples are only positive in Defensive Rally. The regimes are economic content, not just a color scheme.
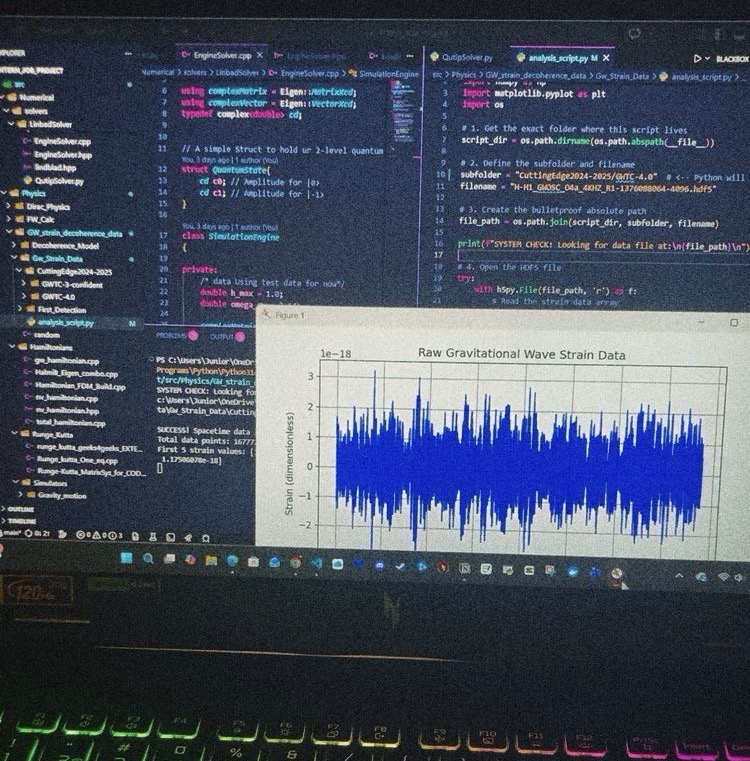
My research interests lie at the interface of quantum theory, gravitational physics and computational modelling. My master's thesis, Quantum Effects of Gravitational Waves, investigated the effective interaction between spin-1/2 quantum systems and weak gravitational-wave backgrounds, using linearised gravity, the tetrad formalism and Foldy–Wouthuysen transformations to derive an effective Hamiltonian. Gravito Ghost Murmur extends this research direction towards computational signal analysis. Can a one-dimensional convolutional neural network detect weak, narrowband strain signals injected into real LIGO data with greater detection efficiency than matched filtering at the same empirically estimated false-positive level?